Subtract Multiple Spectra Automatically
The algorithm used to perform the automatic subtraction is the so-called 'de-wiggle' method, please see the References section below. The method works by iteratively minimizing the first derivative of the subtraction result. The first derivative is used because it gets rid of baseline offsets and minimizes baseline slope.
Using the Auto-Subtract tool, reference spectra can be sequentially subtracted from the sample. This operation is known as 'spectral stripping'.
The Auto-Subtract tool looks like this:
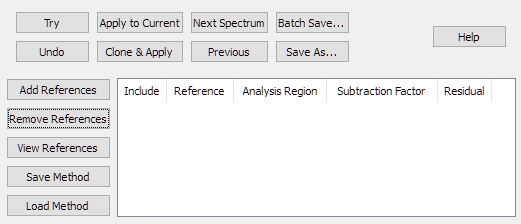
|
| Figure 1. The Auto-Subtract Tool. |
Using the same data as for the Manual Spectral Subtraction example, two references have been added, and the file 'DRYRSMPL.spc' has been loaded into a data window. DRYRSMPL.spc is an extractive gas phase spectrum obtained from a gas-fired wood lumber dryer. As such, it is a mixture of many gases, including carbon dioxide and water. It is suspected that the sample contains methanol. In this tutorial we will use spectral subtraction to investigate this, by sequentially subtracting out interfering spectra. This technique of sequentially subtracting spectra is sometimes called 'spectral stripping'. The data files from this tutorial are installed into the PeakSpectroscopy 'data' documents folder. They are named DRYRSMPL.spc (the wood dryer sample spectrum), H2O-7P.spc (water), CO2-1P.spc (CO2) and MEOH-REF.spc (a methanol library reference spectrum).
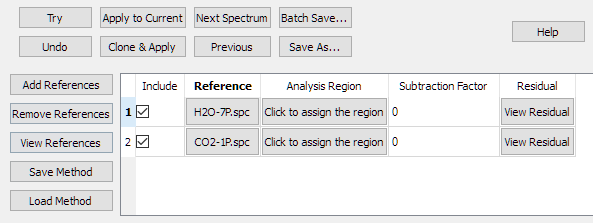
|
| Figure 2. References have been added. |
Click the 'Click to assign the region' button in the 'Analysis Region' column and define the region from 950 to 1100 cm-1. On the region dialog, there is a checkbox that allows you to assign the same region to all References. After assigning the region to the references, the table looks like this:
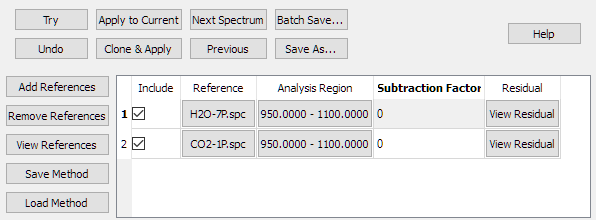
|
| Figure 3. An analysis region has been assigned to the references. |
Click the 'Apply To Current' button and the subtraction is performed. A subtraction factor is calculated for the first reference in the table, and that factor is used to produce a residual. That residual is then the input for calculating the subtraction factor for the second reference spectrum, and so on. The last residual is the result of the automatic subtraction.
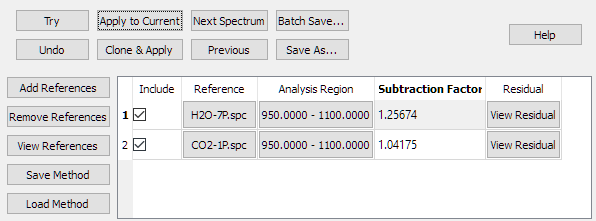
|
| Figure 4. The subtraction has been done. |
In the figure above, the calculated subtraction factors are displayed in the table. The factors may be proportional to the relative concentrations of the references in the sample spectrum.
In this figure, a reference spectrum of Methanol has been superimposed over the subtraction result. The subtraction result is in blue, the reference spectrum in red.
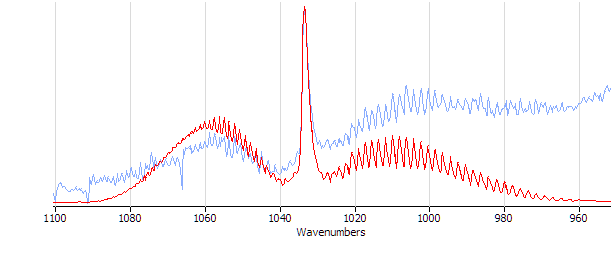
|
| Figure 5. The subtraction result compared to a spectrum of Methanol. |
Note that this result compares well with the manual subtraction result, but is much faster to do and is more reproducible. The reference spectrum table can be saved using the 'Save Method' button so that the method can be re-used with other samples.