The Importance of Baseline Correction in FTIR Spectroscopy
Introduction:
Fourier Transform Infrared (FTIR) spectroscopy is a powerful analytical technique widely used in various scientific disciplines, including chemistry, biology, and materials science. FTIR spectroscopy enables the identification and quantification of chemical compounds based on their unique infrared absorption spectra. However, one common challenge encountered in FTIR analysis is the presence of baseline distortions, which can significantly impact the accuracy and reliability of results. In this article, we will explore the importance of baseline correction in FTIR spectroscopy and understand the reasons behind its necessity.
Understanding Baseline Distortions:
The baseline in an FTIR spectrum represents the signal intensity observed in the absence of sample absorption. Ideally, the baseline should be a straight line at zero absorbance. However, various factors can introduce distortions, leading to a non-flat baseline. These factors include instrumental noise, atmospheric water vapor, and impurities in the sample or solvent.
Importance of Baseline Correction:
- Enhanced Spectral Accuracy:
Baseline distortions can obscure the true absorption peaks in an FTIR spectrum, leading to inaccurate interpretation of results. Baseline correction helps in restoring the baseline to its ideal form, allowing for a clearer and more accurate identification of absorption bands corresponding to specific functional groups. This is particularly important for spectral identification using library search. - Improved Quantitative Analysis:
In quantitative FTIR analysis, accurate peak intensities are crucial for determining the concentration of analytes. Baseline correction minimizes interference from baseline distortions, providing more reliable intensity measurements and improving the precision of quantitative results. - Facilitates Comparison and Interpretation:
Baseline-corrected spectra are easier to compare and interpret, especially when analyzing multiple samples. By eliminating baseline distortions, researchers can confidently identify subtle differences in absorption patterns between samples, aiding in the characterization of materials or compounds. - Reduction of Noise and Artifacts:
Baseline correction effectively reduces noise and artifacts introduced by instrumental factors or environmental conditions. This is particularly important when dealing with weak absorbance signals or trace components in a sample, where accurate baseline correction enhances the signal-to-noise ratio.
Methods of Baseline Correction:
Several methods exist for baseline correction in FTIR spectroscopy, ranging from simple linear corrections to more advanced algorithms. Common approaches include polynomial fitting, asymmetric least squares, and morphological operations. The choice of method depends on the specific characteristics of the baseline distortions present in the spectrum.
Automatic Baseline Correction
Automatic baseline correction techniques play a crucial role in streamlining the process and ensuring efficiency in Fourier Transform Infrared (FTIR) spectroscopy. The Peak software implements several automatic baseline correction algorithms, each designed to address different aspects of baseline distortions. Here are three notable automatic baseline correction techniques integrated into Peak:
- Function Fit:
- This technique involves fitting a polynomial through the spectrum and subtracting that curve from the original spectrum.
- The polynomial fit helps capture and eliminate baseline distortions, providing a corrected spectrum for further analysis.
- Function Fit is a versatile method that can adapt to various baseline shapes, enhancing its applicability across different sample types.
- GIFTS Auto-Leveling:
- GIFTS stands for "Generalized Iterative Fitting of Truncation and Sparsity."
- In this method, the baseline slope and offset are removed by fitting a straight line to the data.
- The process involves iteratively discarding points that do not fit the line well, resulting in an improved baseline-corrected spectrum.
- GIFTS Auto-Leveling is particularly effective in situations where the baseline distortions exhibit a linear trend.
- Adaptive Iteratively Reweighted Penalized Least Squares (airPLS):
- The airPLS algorithm is an advanced method that iteratively changes the weights of sum squares errors (SSE) between the fitted baseline and original signals.
- The weights of the SSE are adaptively adjusted using the difference between the previously fitted baseline and the original signals.
- This adaptive approach enhances the algorithm's ability to handle complex baseline distortions, making it suitable for a wide range of spectroscopic applications.
These automatic baseline correction techniques in Peak offer researchers and analysts the flexibility to choose the most suitable method based on the characteristics of their spectra and the nature of baseline distortions present. The integration of multiple algorithms reflects a comprehensive approach to addressing baseline correction challenges, contributing to the accuracy and reliability of FTIR spectroscopic analyses conducted using Peak software.
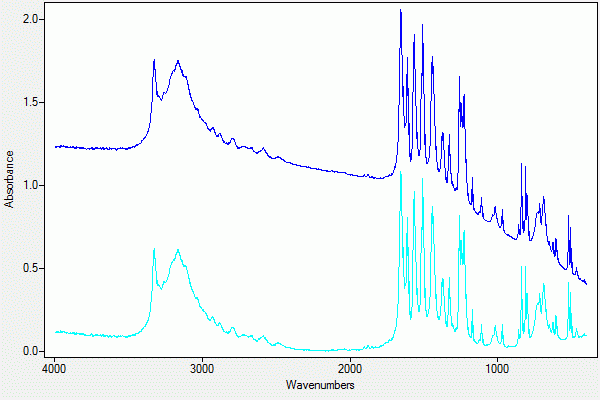
|
| Figure 1. A sample and the baseline-corrected result using Quintic Function Fit. |
Manual Baseline Correction
Manual baseline correction remains a valuable approach in Fourier Transform Infrared (FTIR) spectroscopy, often yielding superior results compared to automatic correction methods. The human eye possesses a remarkable ability to discern between peaks and baseline distortions, making manual correction an intuitive and effective technique. Here's a closer look at the manual baseline correction process:
- User-Defined Points:
- In manual baseline correction, the user actively selects specific points within the spectrum that define the baseline.
- These points are strategically chosen to accurately represent the underlying baseline without including peaks or other spectral features.
- The user's visual acuity enables precise identification of baseline regions, contributing to the accuracy of the correction process.
- Straight Line Segments or Cubic Spline Curve:
- Once the user has defined the points, the baseline can be constructed using straight line segments connecting these points.
- Alternatively, a smooth cubic spline curve can be fitted through the user-defined points, providing a more continuous representation of the baseline.
- The choice between straight line segments and cubic splines depends on the desired level of smoothness and the complexity of the baseline distortions.
- Subtraction Process:
- The manually defined baseline is subtracted from the original spectrum, resulting in a baseline-corrected spectrum.
- This subtraction effectively removes baseline distortions, leaving behind only the true absorption peaks and features of interest.
- The manual nature of this process allows for a fine-tuned correction tailored to the characteristics of the specific spectrum.
- User-Defined Points Replicability:
- The points selected by the user for baseline correction can be saved and applied to other similar spectra.
- This feature enhances efficiency and consistency, especially when dealing with multiple spectra from similar sample types.
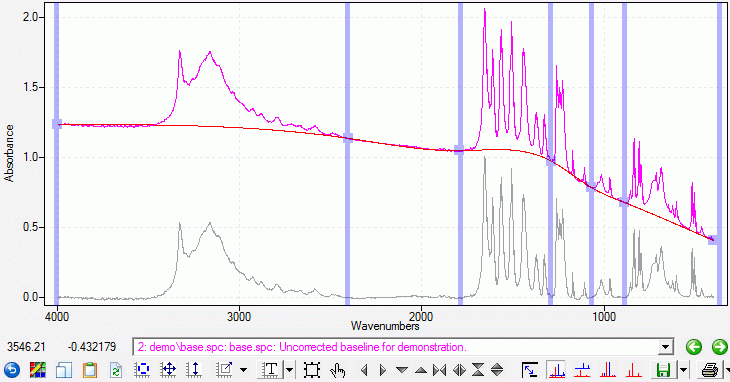
|
| Figure 2. Points chosen by the user to establish a baseline. |
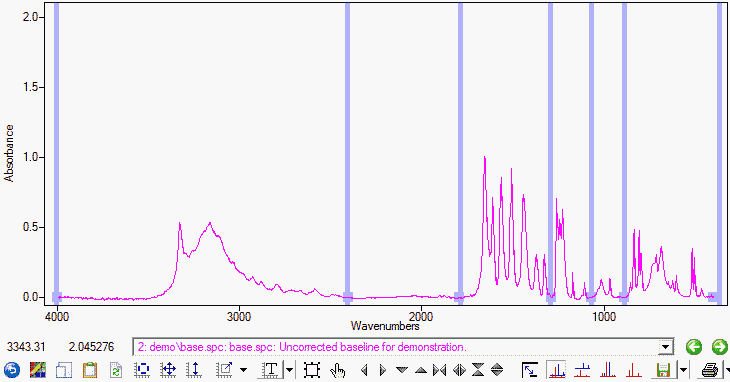
|
| Figure 3. The Applied Baseline Correction. |
While automatic baseline correction methods offer convenience and speed, manual correction excels in scenarios where the human eye's ability to discern subtle features is essential. Researchers and analysts often prefer manual baseline correction for spectra with complex baseline distortions or when a high level of precision is required in identifying peaks and baseline regions. The user's expertise and visual judgment contribute significantly to the success of manual baseline correction in FTIR spectroscopy.
Using a Fitted Baseline as a Background
An advantage of Peak's manual baseline correction is that, in addition to baseline correction of a spectrum, the fitted (estimated) baseline can be saved as a separate file. This fitted baseline can be used as a background spectrum to ratio against sample spectra. That is, the fitted baseline can serve as a sample spectrum's own background. This has uses in applications where it is difficult to get a clean baseline spectrum, such as open-path spectroscopy, or samples taken in the presence of water vapor.
Conclusion:
Baseline correction is a fundamental step in FTIR spectroscopy that plays a crucial role in ensuring the accuracy and reliability of spectral data. By addressing baseline distortions, researchers can enhance the precision of both qualitative and quantitative analyses, leading to more robust conclusions in diverse scientific applications. As FTIR spectroscopy continues to be a cornerstone in analytical chemistry, understanding and implementing effective baseline correction techniques remain essential for obtaining meaningful and trustworthy results.