Analysis of Spectra in Peak® Spectroscopy Software
Results from all analyses can be generate in the .doc (Word), .xls (Excel), .pdf and text formats or exported to the clipboard.
- Compute integrated areas of spectral regions
- Peak Picking automatically tabulates the peaks in a spectrum
- Peak Measurement: computes peak height using user-supplied peak endpoints
- Signal-to-Noise: computes signal-to-noise ratio over user-defined limits
- Spectral Library Search: search unknown spectra against libraries of data.
- QC Compare quickly answers the question: 'is this or is this not what it is supposed to be'
- CIE Color analysis calculates CIE colorimetric values from visible spectra .
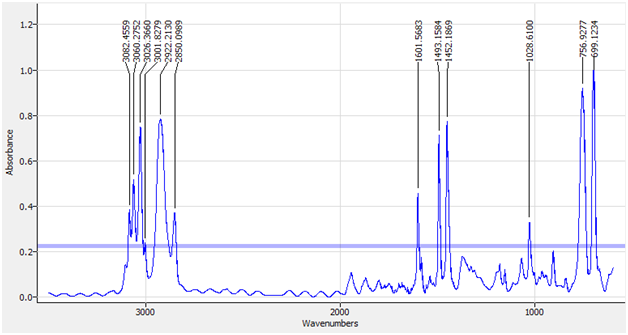 |
| Peak Picking of a Polystyrene spectrum. |