Subtract a Spectrum from a Mixture Spectra
Spectral Subtraction is used with mixture spectra, the goal being to remove contaminant and interferent spectra from a sample to reveal underlying information. The interfering species are often solvents including water, or water vapor and CO2 in the case of gas phase spectra.
Subtraction can be performed manually, or the 'Auto Subtraction' tool can be used. Manual subtraction can be very subjective. If you give N people some spectra to subtract, you will get N different results. In this case, Auto Subtraction can be useful. Please see the Auto Subtraction page.
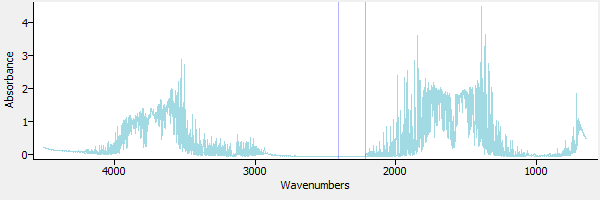
Figure 1 is an extractive gas phase spectrum obtained from a gas-fired wood lumber dryer. As such, it is a mixture of many gases, including carbon dioxide and water (the strongly absorbing CO2 region of 2200 to 2500 wavenumbers has been lined out (ie, 'zapped'). It is suspected that the sample contains methanol. In this tutorial we will use spectral subtraction to investigate this, by sequentially subtracting out interfering spectra. This technique of sequentially subtracting spectra is sometimes called 'spectral stripping'.
The data files from this tutorial are installed into the PeakSpectroscopy 'data' documents folder. They are named DRYRSMPL.spc (the wood dryer sample spectrum), H2O-7P.spc (water), CO2-1P.spc (CO2) and MEOH-REF.spc (methanol).
|
| Figure 1. A sample gas phase spectrum. |
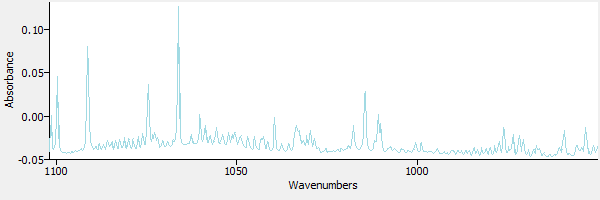
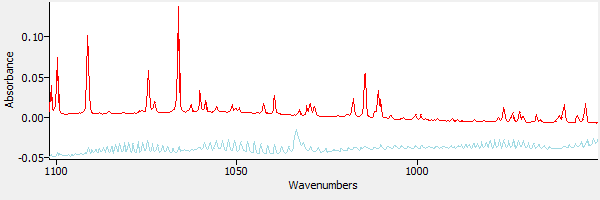
Figure 2 is a view of the same spectrum, zoomed in to the region around 950 to 1100 wavenumbers, a region where methanol has strong absorbance bands.
|
| Figure 2. |
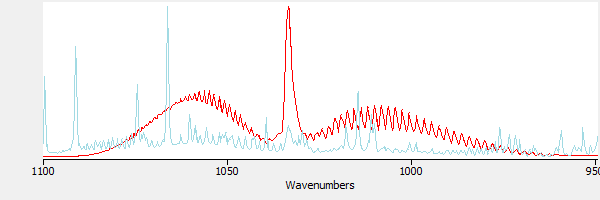
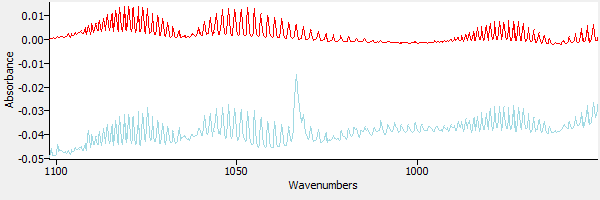
Figure 3 includes a library reference spectrum of methanol. The presence of methanol in the sample is not apparent. Without subtraction, it would be difficult to identify the methanol in this sample.
|
| Figure 3. The sample and methanol, superimposed. |
First, a spectrum of water is subtracted. Figure 4 shows a library reference spectrum of water (in red) overlaid with the sample spectrum.
|
| Figure 4. The sample spectrum and water. |
Using the 'Subtraction' tool in eFTIR, the water spectrum is subtracted from the sample spectrum, removing the peak at 1066 wavenumbers. Figure 5 shows the subtraction result.
|
| Figure 5. The sample after subtracting water. |
Next a spectrum of CO2 is loaded into the window. Figure 6 shows the CO2 spectrum overlaid on the (water-subtracted) sample spectrum.
|
| Figure 6. The sample spectrum and CO2. |
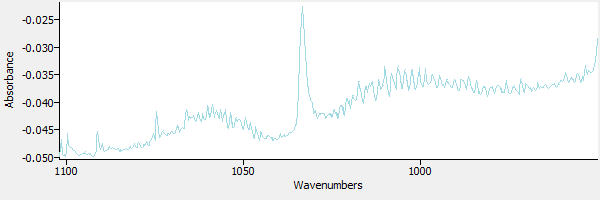
The CO2 is subtracted from the sample. The result is shown in Figure 7.
|
| Figure 7. CO2 has been subtracted from the sample. |
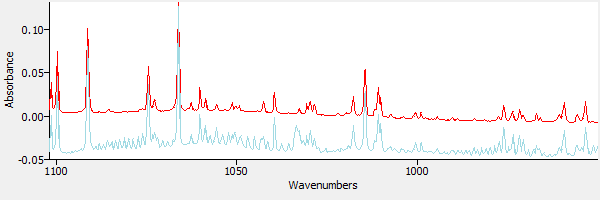
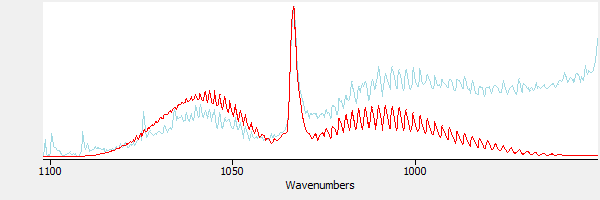
In Figure 8 a library reference spectrum of methanol is superimposed over the result from Figure 7. The methanol reference is in red, and the subtraction result is in blue.
|
| Figure 8. Comparing the spectrum of methanol with the subtracted result. |