Peak Interactive Data Display
Peak display features let you visually examine spectra in many modes, and with complete interactive expand, roll and zoom and autoscaling.
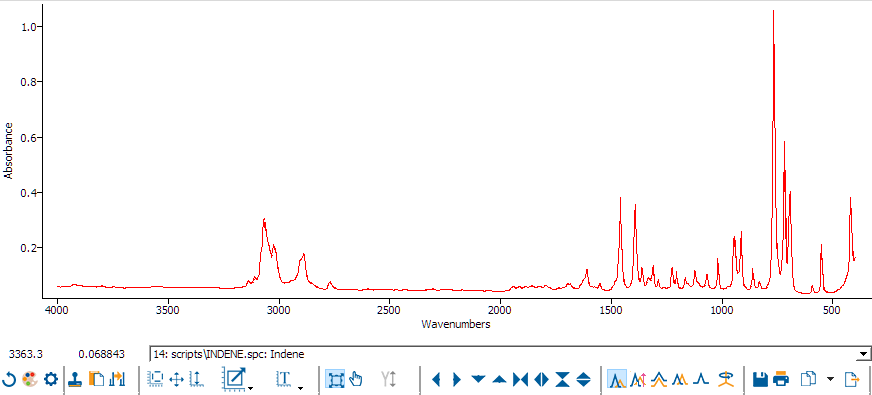
At the bottom of each data window is a row of icons that control the display format.
At the bottom of each data window is a row of icons that control the display format.
 |
Undo data manipluations |
 |
Pick new colors for spectra |
 |
Setup display parameters |
 |
Copy the active spectrum to the internal clipboard |
 |
Paste spectrum from the internal clipboard |
 |
Create a copy (clone) of the active sample |
 |
Apply fixed scale |
 |
Autoscale the displapy on the x and y axes |
 |
Autoscale on the y axis |
 |
Undo display zooms |
 |
Change between Absorbance and Transmittance, or Wavenumbers and Wavelengths |
 |
Enter expand (rubber-band) display mode |
 |
Entry drag display mode |
 |
Manually position spectra in the window (in offset display mode only) |
 |
Roll the display to the left |
 |
Roll the display to the right |
 |
Roll the display down |
 |
Roll the display up |
 |
Zoom in on the X axis |
 |
Zoom out on the X axis |
 |
Zoom in on the Y axis |
 |
Zoom out on the Y axis |
 |
Display data in overlay mode |
 |
Offset spectra on the Y axis |
 |
Display spectra in stack mode |
 |
Display spectra in superimpose mode |
 |
Display only the active sample |
 |
Display data in 3-D |
 |
Save the active spectrum |
 |
Print: bring up the Plot Layout Editor |
 |
Export the display as a bitmap or Scaled Vector graphic |
 |
Export the spectra to other data formats |
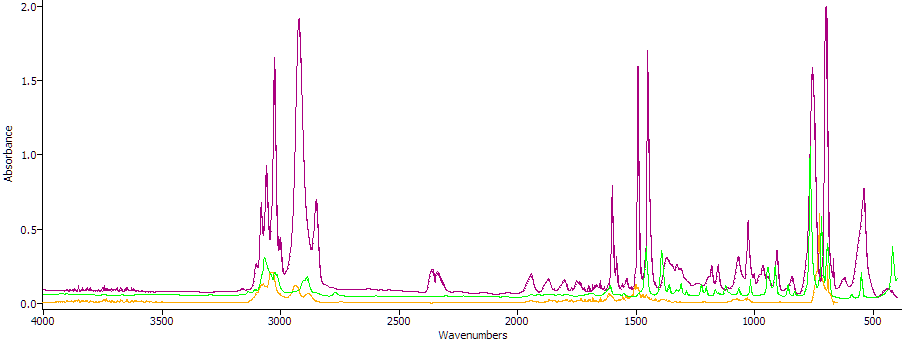
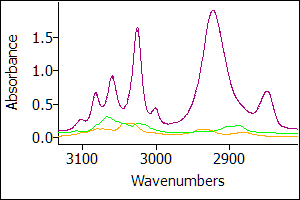
Spectral display in Overlay Mode
Spectral display in Offset Mode
In this mode, individual spectra can be dragged to position them where needed.
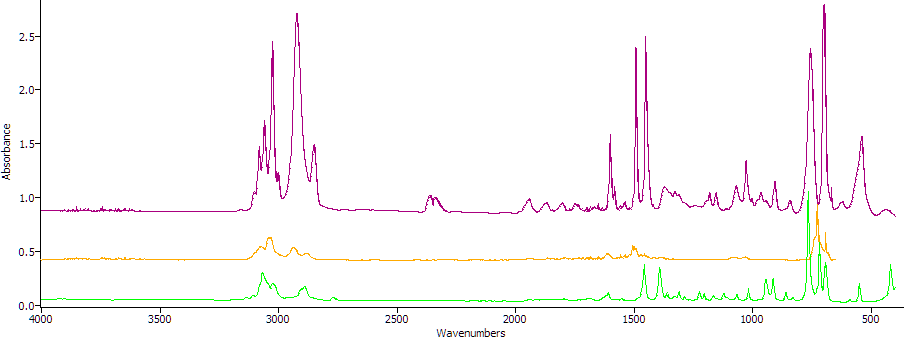
Spectral display in Stack Mode
Each spectrum is displayed in its own layer
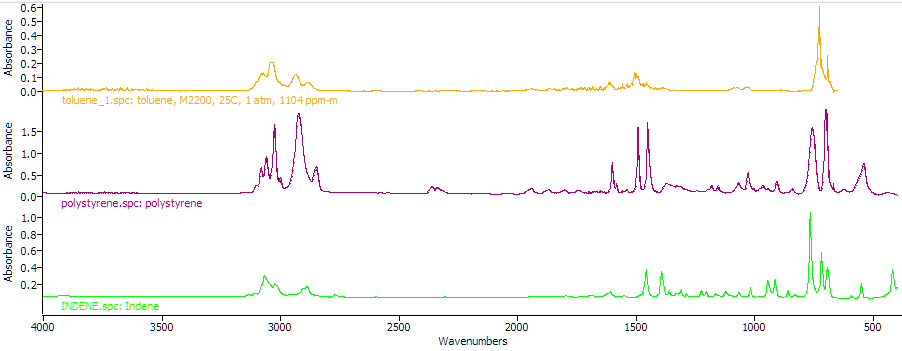
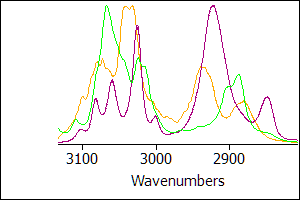
Spectral display in Superimpose Mode
This is especially useful when zoomed in on spectral regions as it puts spectra on a common y-axis scale
| This plot is in overlay mode | This plot is in superimose mode |
|
|
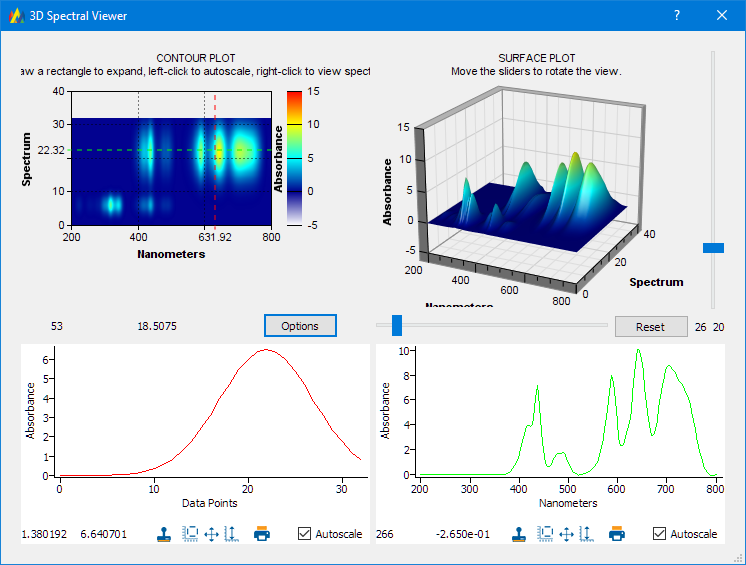
The interactive 3-D data viewer
The surface plot can be rotated. Clicking on the Contour plot will display the spectrum (absorbance vs wavenumber) and slice (absorbance vs time/distance) at those coordinates